Grafana
Everything you need to visualise and explore your Capture data in Grafana, combining ready-made dashboards with native access to your UNS.
Dashboards
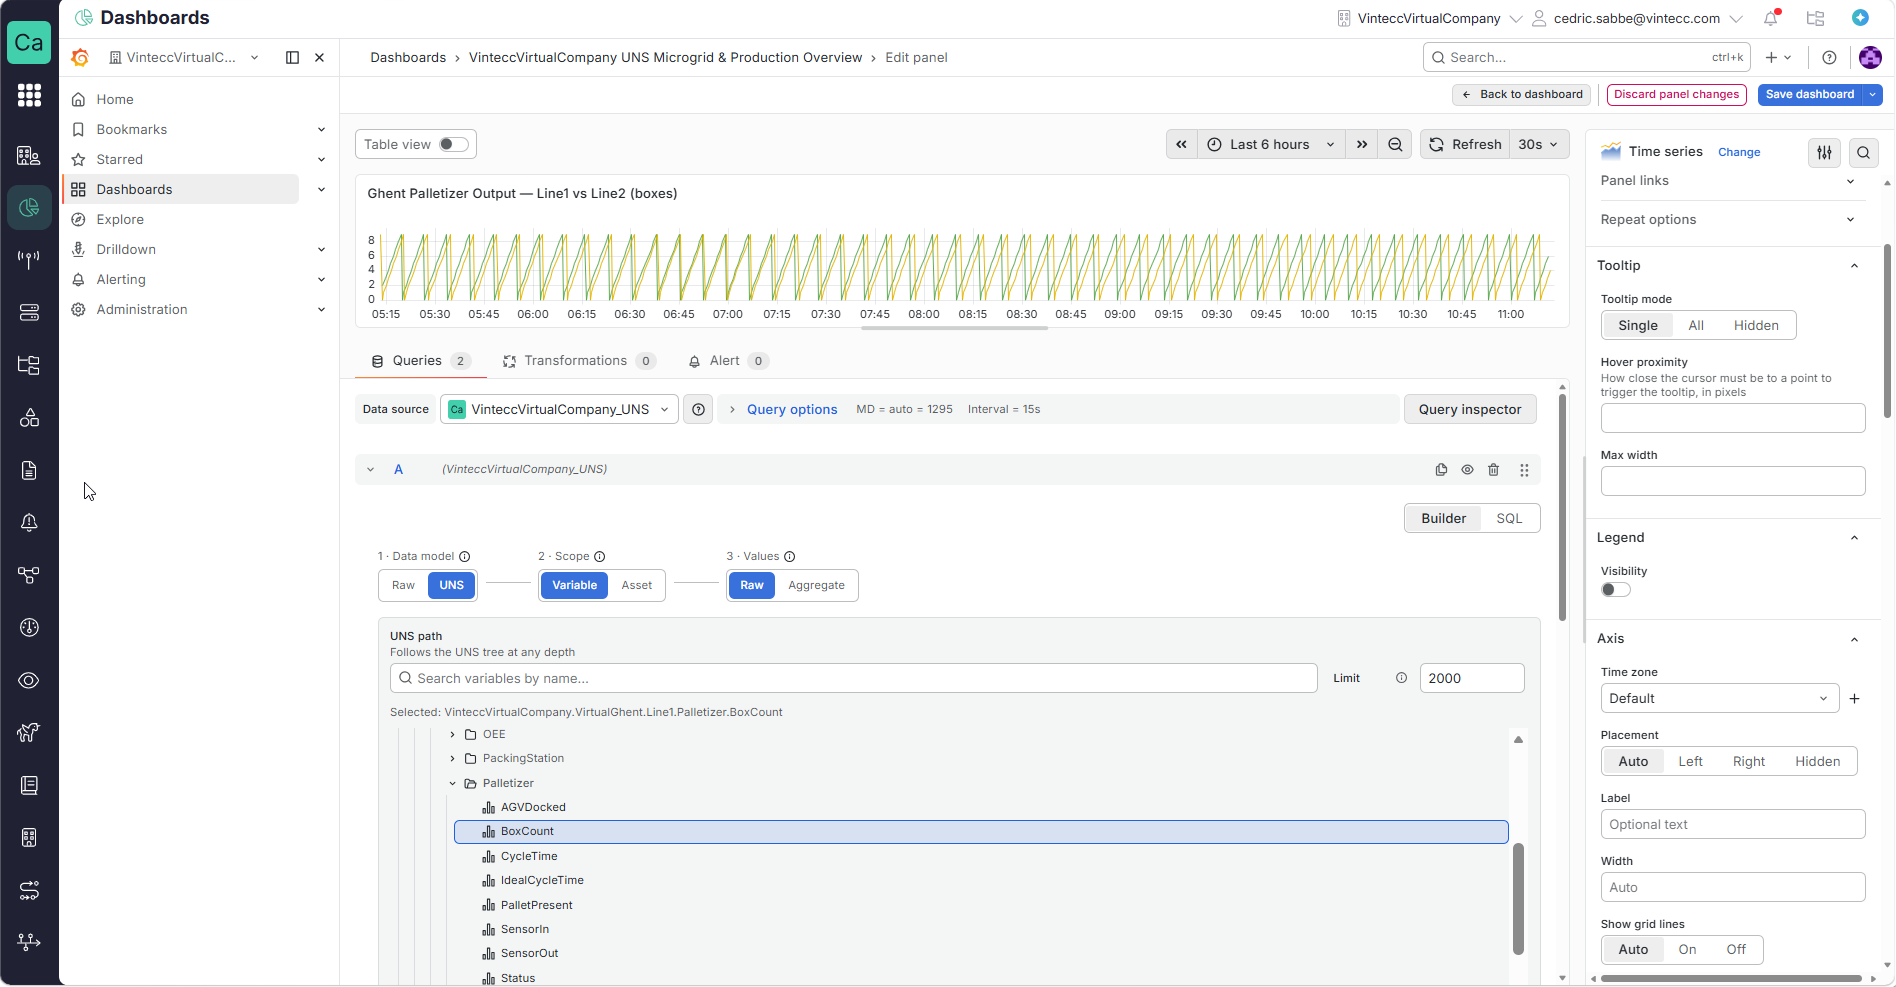
Provides interactive dashboards and visualizations based on Capture data (time-series, KPIs, events) via native connection with UNS and Historian.
✓ Connects directly to time-series data sources
✓ Supports real-time charts and tables
✓ Supports filtering by asset or time period
✓ Alert history and analytics
✓ Manages access rights per dashboard
UNS Plugin
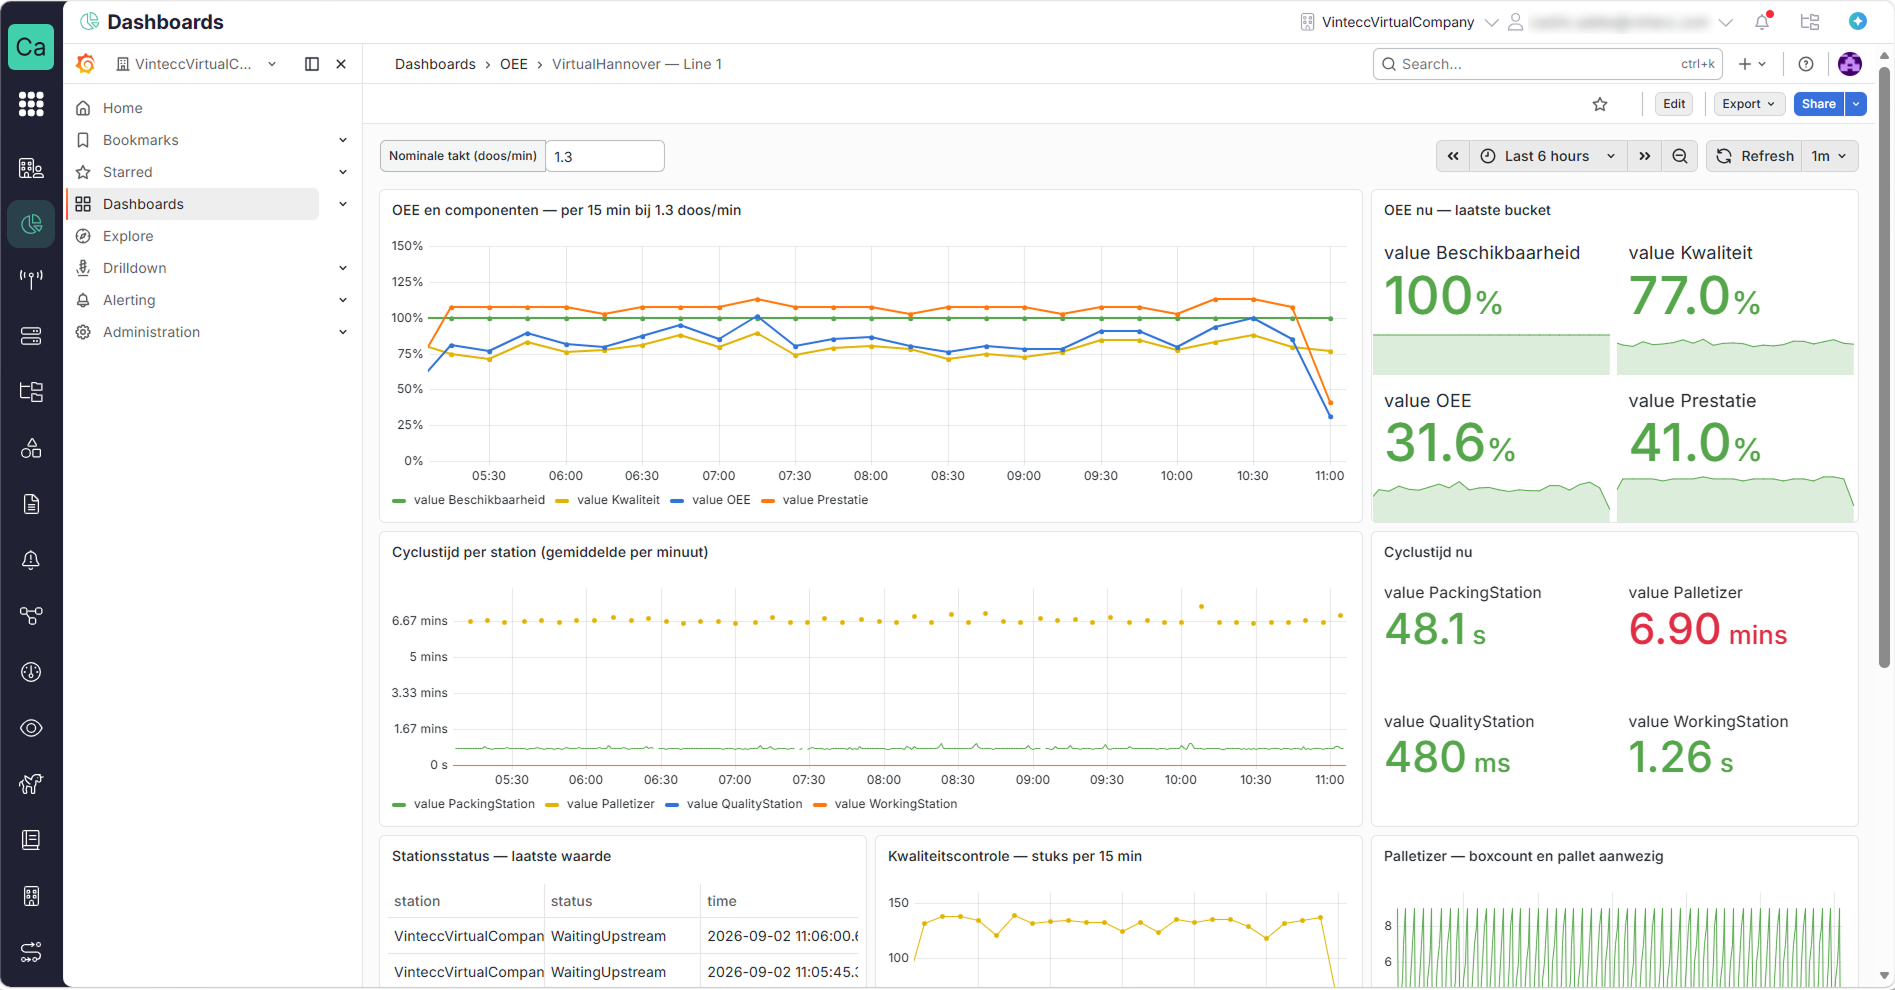
Adds Capture UNS as a native data source in Grafana, so you can browse and query your data without leaving the dashboard.
✓ Adds Capture UNS as a native data source in Grafana
✓ Browse both UNS and raw data directly within Grafana
✓ Navigate your data through a UNS tree view and asset view
✓ Browse data without writing a query
✓ Use the query builder when you need more advanced queries